
Keywords: interactive tools, image data, customization
25.1. Introduction ↩
The sdscatter command may run user-defined function each time a data
sample is clicked. This allows us to visualize data related to a specific
sample depending on our application.
Say, our problem concerns the pose-recognition application, discussed in this video. The person in the video frame is detected by fitting a torso model. Parameters of the model are used for classifying the human pose. This data set was provided by TU Delft researchers Drs.Feifei Huo and Prof.Emile Hendricks.
The data set contains 2800 examples of nine poses gathered from 13 persons:
>> a
2809 by 6 sddata, 9 classes: [572  1022    24    46   206   114   201   220   404]
We may see the available meta-data using:
>> a'
2809 by 6 sddata, 9 classes: [572  1022    24    46   206   114   201   220   404]
sample props: 'lab'->'class' 'class'(L) 'frame'(N) 'person'(L)
feature props: 'featlab'->'featname' 'featname'(L)
data props:  'data'(N)
Apart of class label, each example contains the frame number and person label.
We me access the meta-data similarly to structure fields
>> a.lab
sdlab with 2809 entries, 9 groups

>> a.lab'
 ind name               size percentage
   1 pose1               572 (20.4%)
   2 pose2              1022 (36.4%)
   3 pose3                24 ( 0.9%)
   4 pose4                46 ( 1.6%)
   5 pose5               206 ( 7.3%)
   6 pose6               114 ( 4.1%)
   7 pose7               201 ( 7.2%)
   8 pose8               220 ( 7.8%)
   9 pose9               404 (14.4%)

>> a.person
sdlab with 2809 entries, 13 groups
The frame and person label for a specific data sample:
>> a(1).frame

ans =

   299

>> a(1).person
sdlab with one entry: 'Berend'
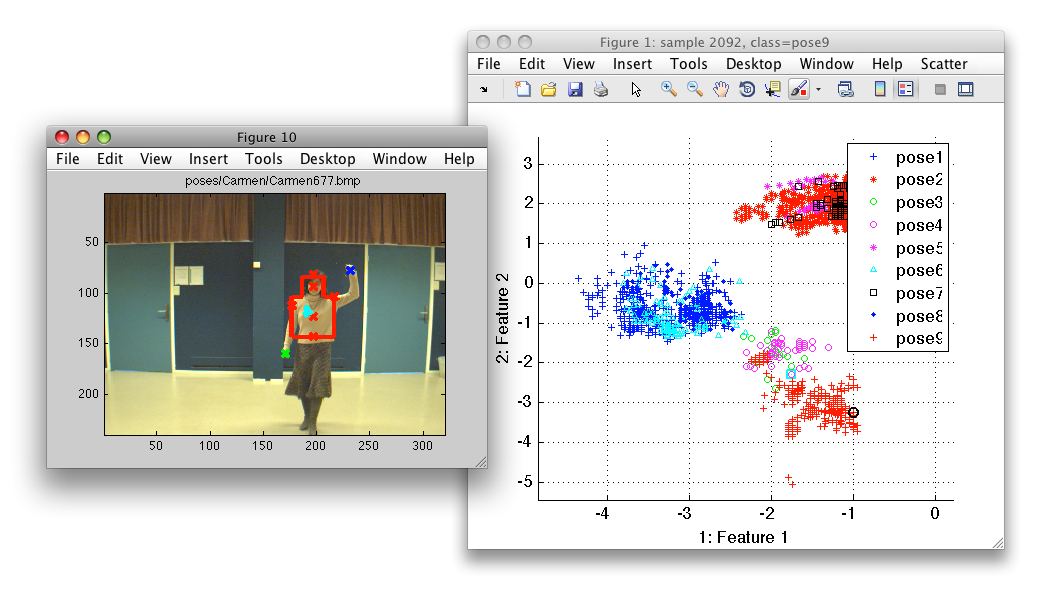
We would like to visualize the frame image corresponding to a sample
clicked in sdscatter figure. To do so, we need to write a Matlab function
that loads the image corresponding to a sample and shows it in a separate
figure.
function show_frame(data)

frame=data.frame;
person=strtrim(+data.person);

% image path is 'poses/Name/NameXX.bmp' where XX is a frame number
image_path=fullfile('poses',person,[person num2str(frame) '.bmp']);

im=imread(image_path);

figure(10);
imagesc(im);
title(image_path)
The show_frame.m function will receive from sdscatter the data set
object data containing the clicked example. We extract the frame number
and person name from data. The unary plus operator converts the
sdlab object into string. Next, we compose image_path variable
and load the image file. Finally, we show the image in a specific figure.
To use this custom function, we only need to call sdscatter with the
'callback' function:
>> sdscatter(a,'callback',@show_frame)

ans =

 1
When we click on a sample, sdscatter calls show_frame.m which opens the
respective image in figure 10.
25.1.1. Passing parameters to the callback function ↩
Note, that our show_frame function hard-codes the figure used for image
visualization. It would be more practical to decide what figure to use at
the moment we call sdscatter. We may do just that by passing an
additional parameter after the callback function handle.
We may modify our function to accept a figure number as the second parameter:
function show_frame2(data,figh)

frame=data.frame;
person=strtrim(+data.person);

% image path is 'poses/Name/NameXX.bmp' where XX is a frame number
image_path=fullfile('poses',person,[person num2str(frame) '.bmp']);

im=imread(image_path);

figure(figh);
imagesc(im);
title(image_path)
We can now start the sdscatter providing the handle of the specific figure:
>> figh=figure

figh =

 2

>> sdscatter(a,'callback',@show_frame2,figh)

ans =

 3
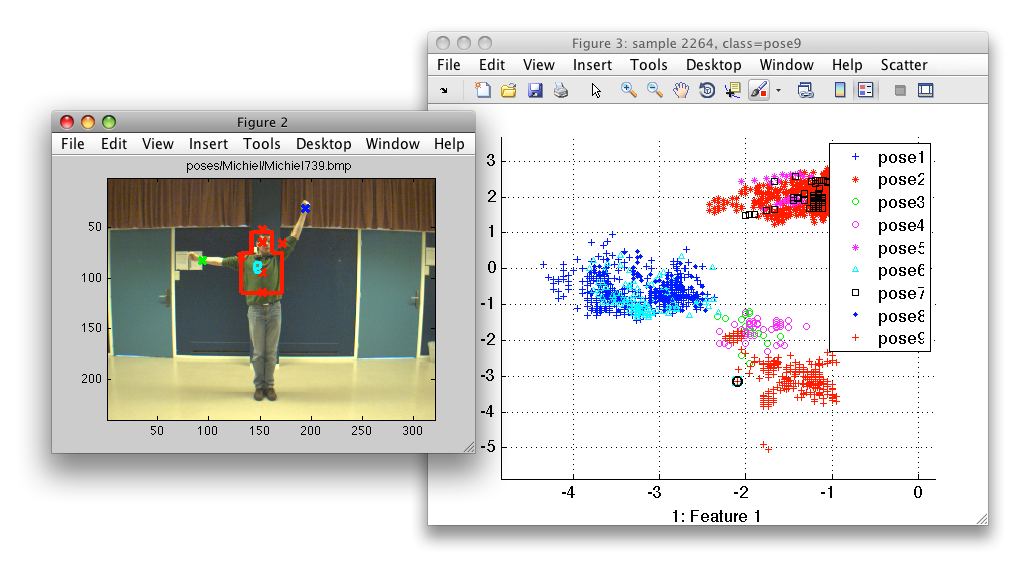
Note, that the additional parameter, passed to sdscatter, may be only one
and it cannot be string. If we need to pass multiple parameters, we may
wrap them into a structure or a cell array.
We may use custom callbacks to understand why are certain observations misclassified or why are they outliers.