Spectral cube visualization
If the spectral cube specifies default R,G,B bands, like in our example, the image will open in false-color preview mode. Otherwise, the single band mode is used.
You may drag the R,G,B lines in the spectral plot to adjust the false-color view. As you can see, the scan was acquired by a sensor operating in NIR spectral range (900-1700nm). Therefore, the colors are only visual aid and do not corresond to the color of the physical objects.
Moving the mouse over the image, you will see the spectrum at each point as a white line in the spectral plot. Details on pixel coordinates, wavelength and a value can be found in the status bar area.
You may switch to the single band mode using the Cube button on the toolbar.
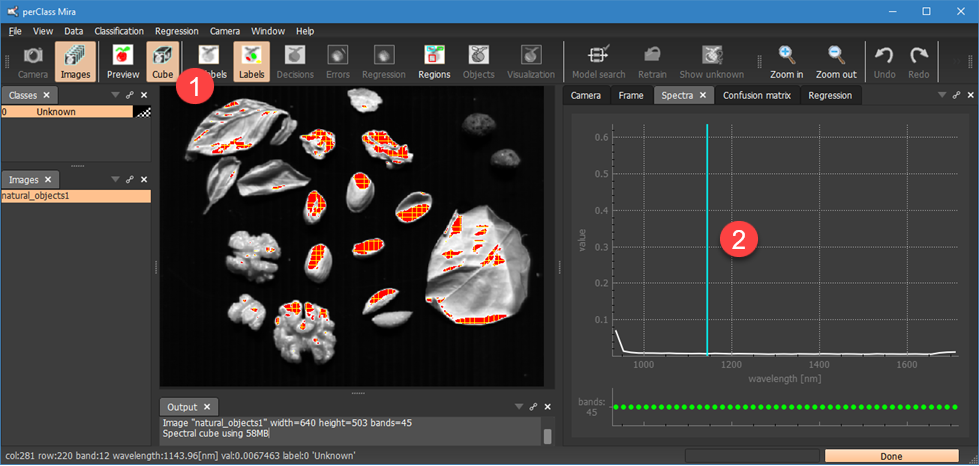
Dragging the blue line  in the spectral plot, you may change the band. Note the band index and wavelength in the status bar.
Note the red pattern on some of the pixels. This is a visualization feature that highlights pixels with values higher than the current maximum bound of the spectral plot.
You may adjust the spectral plot range using the mouse wheel or by clicking and dragging in the spectral plot.
We will load the second image. Select again Add images to project...in the Images context menu and select natural_objects2.hdr.
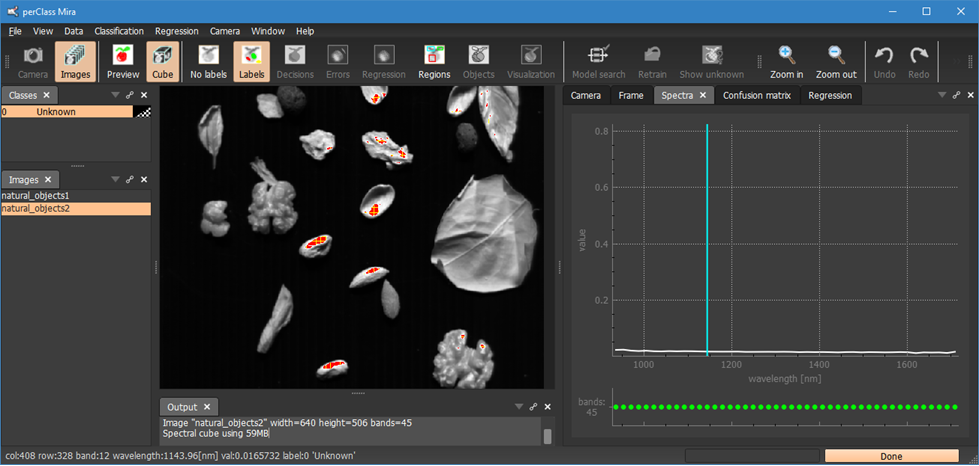
Note, that the spectral plot bounds do not change when moving between images. With the manual spectral bounds, you always see comparable view of the data.
We may also enable auto stretch of image brightness in the spectal plot context menu (via right mouse click).
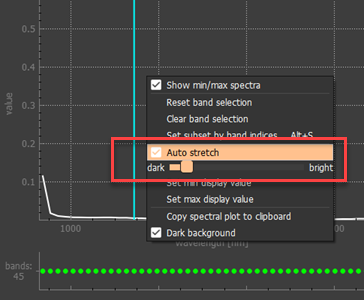
The auto-stretch extends brightness of each image so that a fixed percentile of the image histogram is visualized. The percentile can be adjusted by the slider.
When moving between the images, note that the spectral plot bounds change depending on the image histogram. The auto-stretch mode assures you alwas see "something" irrespective how bright or dark an image is. You leave the auto-stretch mode by either disabling it in the menu or manually adjusting the spectral plot bounds.
TIP: The red pattern for pixels above the top spectral plot bound can be changed into white color in View / Show saturated data as menu command